Using cointegration tests to construct crypto portfolios
By Tim Leung, Ph.D.
In 2009, Bitcoin (BTC) was introduced to become the first decentralized digital currency. Since then, Bitcoin has been accepted by thousands of merchants and vendors, and the cryptocurrency market has seen enormous growth. Today, there are more than a thousand of cryptocurrencies besides Bitcoin, such as Ethereum (ETH), Litecoin (LTC), Bitcoin Cash (BCH), and more that are being traded on major cryptocurrency exchanges internationally.
Throughout the years, many substitutes of Bitcoin have been invented for various reasons. For instance, Ethereum, a decentralized platform that run smart contracts, was created to address the lack of a scripting language of Bitcoin for application development. As another example, Bitcoin Cash was invented to address the scalability issue of Bitcoin due to its block size limit which put a cap on the amount of transactions Bitcoin network can process on a given time frame, etc. Such innovations have led to the rapid growths of many altcoins together with the rise in market size of cryptocurrency. Still, Bitcoin have consistently been ranked on top in terms of traded volume, price and market capitalizations.
The rise of Bitcoin and many altcoins has created trading opportunities for investors and speculators. In fact, studies have shown that there are very low correlations between the CRyptocurrency Index (CRIX), a portfolio of cryptocurrencies, and traditional assets. Also, empirical results show that including CRIX in an initial portfolio consisting only traditional assets can expand the efficient frontier and give additional utility to investors.
Recall that S&P 500 returned around 21% back in 2017, but Bitcoin gained an astounding 1,318% in one year. In mid December 2017, Bitcoin price reached all-time-high at over $19 thousand, with 24h volume approximately $23 billion. However, as price plummeted to a low $6000 in early February. Once considered as one of the greatest bubbles, Bitcoin has surged during the COVID-19 pandemic and has been more widely accepted as an inflation hedge like gold.
Many crypto exchanges allow investors to purchase coins directly from their bank accounts and then transfer the coins to different digital wallets and exchanges for trading purposes. Some exchanges even allow short selling of cryptocurrencies.
Unlike traditional equity market, most cryptocurrencies are highly correlated. For example, correlations on daily returns between the 4 digital currencies, i.e. BTC, ETH, LTC, and BCH, were over 75%. The high volatility of cryptocurrencies calls for the development of market-neutral trading strategies, and their high correlations motivates us to investigate cointegration or mean-reversion strategies.
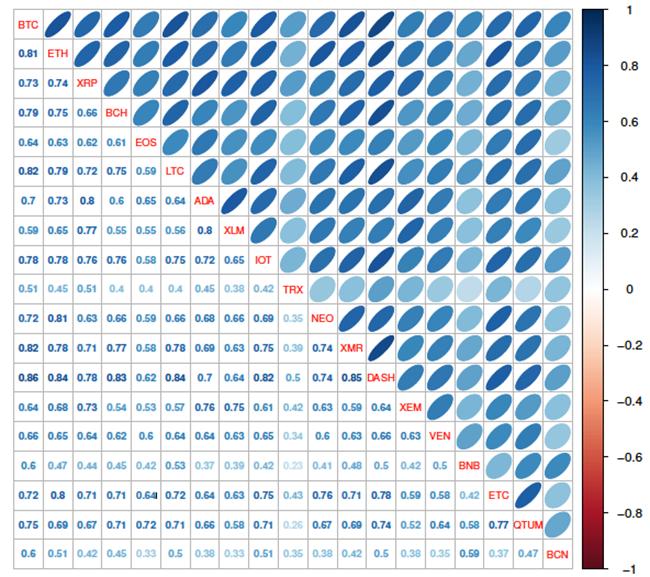
Correlation of daily returns among cryptos.
Mean-reversion trading strategies have been extensively researched and studied by academic researchers and practitioners who seek to understand the long-term co-movements of different asset prices and arbitrage from the mean-reverting property of the price spread.
Strategies have been developed for many areas of traditional finance, but very little research has been done for trading pairs or baskets of cryptocurrencies. In fact, most research on trading cryptocurrencies are based on technical analysis, or arbitraging from price differences across exchanges.
Through a series of statistical tests, we create a tradable portfolio involving Bitcoin (BTC), Ethereum (ETH), Bitcoin Cash (BCH), and Litecoin (LTC) with fast mean-reverting price movements.
In our recent study (Nguyen and Leung, 2019), we analyze the process of constructing a cointegrated set of cryptocurrencies. The process involves a series of statistical tests, including the (i) Johansen cointegration test, and (ii) the classical 2-step approach developed by Engle and Granger.
Among our results, we construct cointegrated portfolios involving four cryptocurrencies: Bitcoin (BTC), Ethereum (ETH), Bitcoin Cash (BCH), and Litecoin (LTC). The cointegration tests give a tradable portfolio since the fast mean-reverting spread would cross the entry and exit levels frequently. The strategy is based on trading the spread of the form:
Spread = BTC- a*ETH- b*LTC- c*BCH,
It’s interesting that the two cointegration tests actually generate different mean-reverting portfolios.

Spread constructed from two approaches: (left) Johansen methodology, (right) Engle-Granger methodology
Observing from the figure above, it is hard to see which spread appears to be more stationary or mean-reverting. However, from a trading perspective, periodic movements or fluctuations that lead to frequent crossing of the equilibrium levels from both directions are desired, especially given that entry and exit rules are based on deviations from the mean price.
For this reason, the Engle-Granger approach is more practical to trade in this example and is thus chosen for back-testing our trading system. We also install entry and exit price thresholds measured in terms of standard deviations from the mean. To mitigate the effects of higher drawdown, we also add a stop-loss order at 5%.
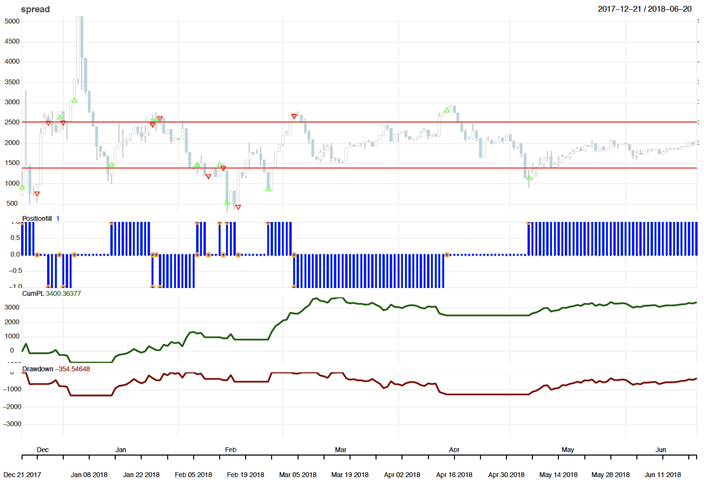
Trading system with 5% stop-loss, setting entry/exit level at minus/plus 1 standard deviation from the mean. From top to bottom, we plot the spread, position (-1,0,+1; blue), cumulative PnL (green), and drawdown (red).
We find that setting greater entry and exit levels leads to larger profits (see table below). In comparison to trading systems with a stop-loss exit or trailing stop, the one without yields the highest profit but also largest drawdowns. In addition to building this new crypto portfolio, our methodology can be applied more generally to create new cointegrated portfolio using other cryptocurrencies.
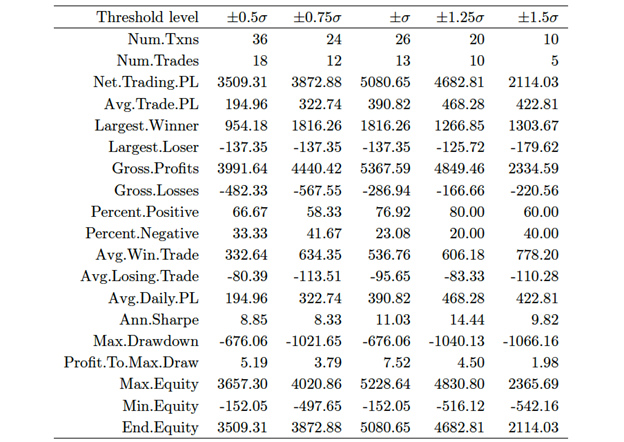
Statistics for the trading strategy with 5% trailing stop-loss during testing period. Glossary of trade statistics is provided below.
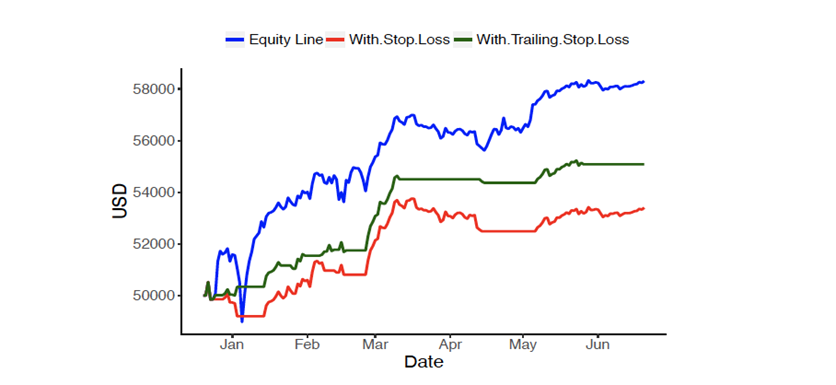
Equity curves: (top) without stop-loss/trailing stop, (middle) with a 5% trailing stop, and (bottom) with a 5% stop-loss.
As the cryptocurrency market continues to grow with new coins and new exchanges, it’s very important for individual investors, crypto-fund managers, as well as regulators to understand the price dependency among all cryptocurrencies, along with their derivatives. There are many directions for future research. One of our projects involves developing a machine learning approach that automatically selects a small portfolio from a vast universe of cryptocurrencies.
Click here a full analysis (free pdf) on the cointegrated crypto portfolio discussed above.
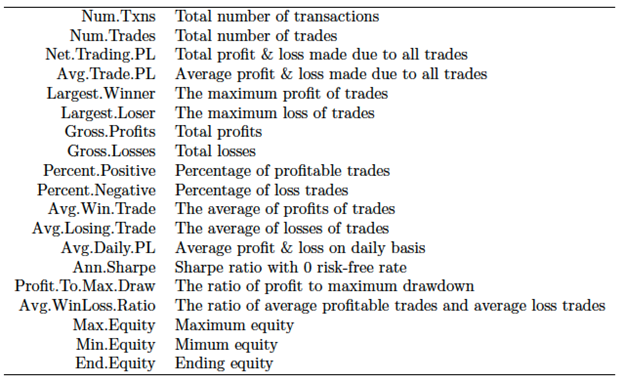
Trade statistics explanations
References
H. Nguyen and T. Leung (2019), Constructing Cointegrated Cryptocurrency Portfolios for Statistical Arbitrage, Studies in Economics and Finance, Vol. 36 №3, pp. 581–599
Disclaimer
This article represents the opinions and view of the author(s) and not, necessarily, of Qdeck. The content of this article is provided solely for informational purposes and general education, and in no way should be considered investment advice.
This communication is provided for informational purposes and should not be construed as a recommendation or solicitation or offer to buy or sell futures contracts, securities or related financial instruments, nor as an official confirmation of performance. Past performance is not necessarily indicative of future results. Investment in any program is speculative and involves significant risks, including risks of loss. There can be no assurance that the programs will be able to realize their objectives.
