By Tim Leung, Ph.D.
ETFs are relatively new financial products and have gained popularity in recent years. The ETF industry now consists of thousands of funds with well over $5 trillion in assets. All ETFs are traded on major exchanges like stocks, and most are designed to track an index or asset. For many investors, ETFs provide various desirable features such as liquidity, diversification, low expense ratios, and tax efficiency.
Leveraged ETFs
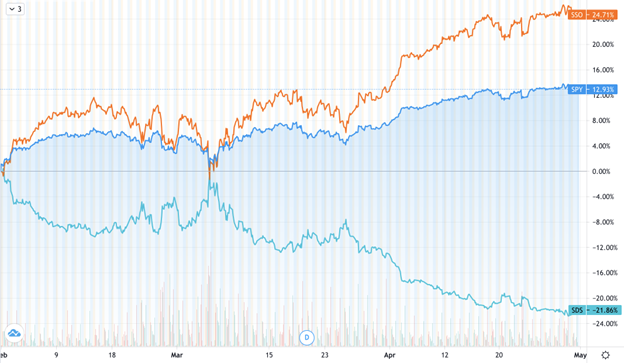
Within the ETF universe, some funds are designed to replicate a constant multiple (called leverage ratio) of the daily returns of a reference index. These relatively new financial products are called leveraged ETFs (LETFs). For example, the ProShares Ultra S&P500 (SSO) is an LETF on the S&P 500 with leverage ratio β = +2, which is supposed to generate twice the daily return of the S&P 500 index.
The leverage ratio can also be negative, meaning the LETF is taking a short position in the underlying’s returns. In particular, by longing an inverse LETF, an investor can short the underlying without conducting a short-selling transaction or facing the associated margin requirement. As an example, the ProShares UltraShort S&P500 (SDS) is an LETF on the S&P 500 with β = −2.
There are also triple leveraged LETFs, such as ProShares UltraPro S&P 500 (UPRO) with β = +3, and ProShares UltraPro Short S&P 500 (SPXU) with β = −3.
The proliferation of (L)ETFs has generated a host of new research problems. For instance, how well do these funds track their advertised benchmarks? Is there a mathematical connection between an (L)ETF and its reference index? What is the best trading strategy for tracking a given index?
In a series of papers, we investigate the tracking performance of a wide array of equity and commodity LETFs and measure their tracking errors compared to their respective benchmarks. We also construct a dynamic leveraged portfolio using short-term futures and demonstrate that this portfolio tracks the benchmark better than the market-traded LETF over a long out-of-sample period.
LETF Implied Vols
Surprisingly, even during the political climate for deleveraging in the aftermath of the 2008 Financial Crisis, markets for options on LETFs, which contribute an additional layer of leveraging, have grown, and it is important to analyze how these markets reflect volatility risk.
For (L)ETFs that track the same reference index, their associated options have very similar sources of randomness. This gives rise to the question of consistent no-arbitrage (no-free-lunch) pricing of options on ETFs and LETFs.
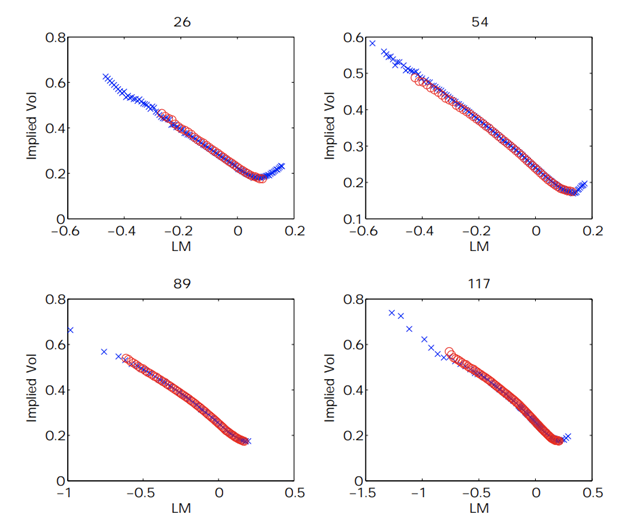
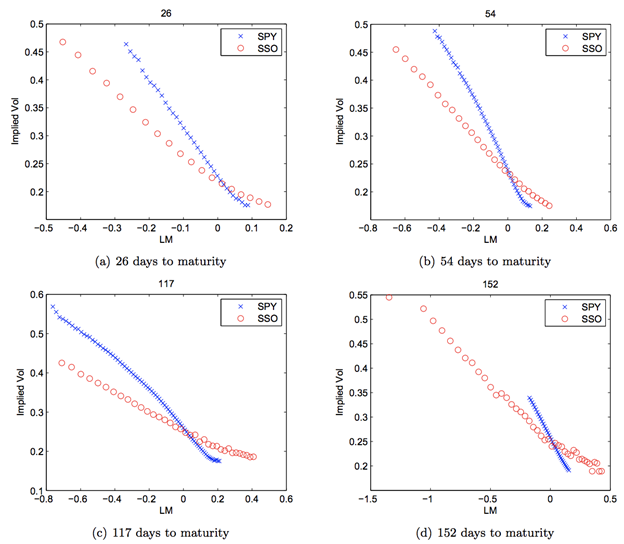
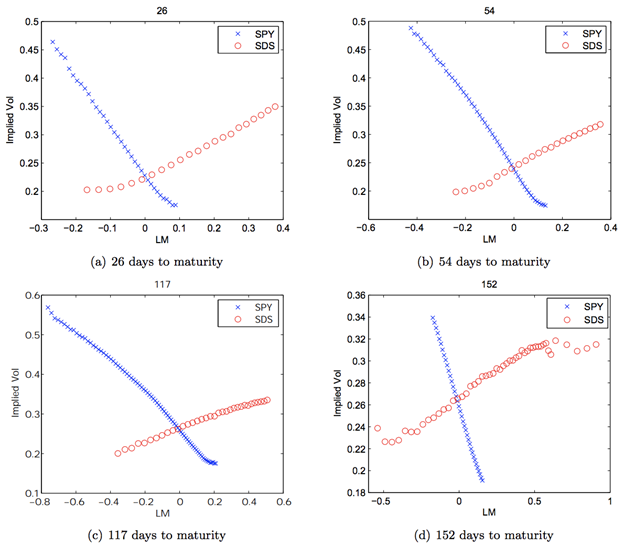
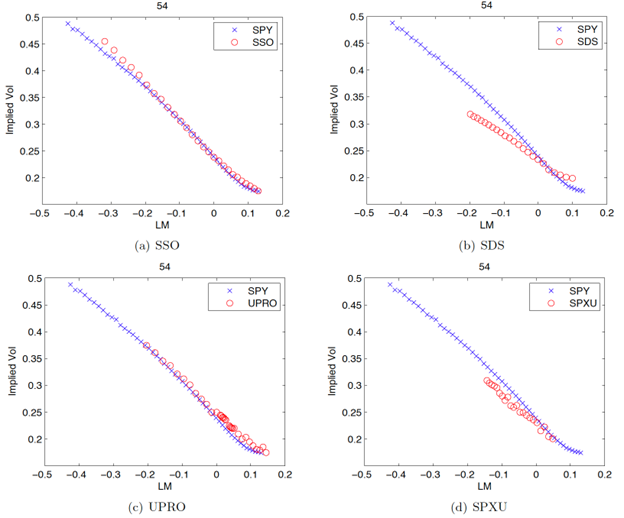
The most salient features of the empirical implied volatilities (IVs) in Figures 1-3 are:
- the IV curve for SSO (β = 2) appears to be flatter than that for SPY (β = 1),
- the IV curve for SDS (β = -2) is upward sloping as opposed to downward sloping like those for SPY (β = 1) and SSO (β = 2).
The second observation is intuitive because higher implied volatility is commonly associated with more bearish options positions, such as OTM puts, written on the S&P 500 index. For β > 0, this corresponds to the LETF puts with strikes less than the spot LETF price. For β < 0, the bearish positions correspond to the LETF calls with strike greater than the spot LETF price, giving rise to an upward sloping implied volatility. In fact, these features are persistent across other dates, including a year-long dataset.
Implied Vol Scaling
There are mathematical connections among the implied volatilities derived from options prices on leveraged and unleveraged ETFs. We also introduce the concept of moneyness scaling and provide a new formula that links option implied volatilities between leveraged and unleveraged ETFs. This is useful not only for options trading, but also for market-making. For instance, in order to sell a far OTM LEFT call/put, then the market maker can use the corresponding implied volatility from the SPY options market to derive the price for the LETF option in question. Under a general stochastic volatility framework, we develop analytical approximations and numerical methods to price LETF options and derive mathematical formulas for price comparison across different options markets. Our empirical evidence also suggests potential price discrepancies among ETF options with different leverage ratios.
Looking forward, as the market of ETFs continues to grow in terms of market capitalization and product diversity, there are plenty of new problems for future research. The availability of high-frequency trading data also permits the analysis of the intraday return patterns and arbitrage relationships of these funds compared to their reference assets.
References
Leung and Sircar (2015), Implied Volatility of Leveraged ETF Options [pdf], Applied Mathematical Finance, vol. 22, issue 2, pp.162–188, 2015
Leung et. al (2017), Leveraged ETF Implied Volatilities from ETF Dynamics [pdf;link],Mathematical Finance, Volume 27, Issue 4, pp.1035–1068
Leung and Santoli (2016), Leveraged Exchange-Traded Funds Price Dynamics and Options Valuation [link], Springer Briefs in Quantitative Finance, Springer
