The difference is day and night
By Tim Leung, Ph.D.
Foreign company stocks listed in US exchanges are commonly registered as American Depositary Receipts (ADRs). These are certificates, denominated in U.S. dollars, that represent shares of non-U.S. company securities. There are about 2000 ADRs traded on U.S. exchanges, namely NYSE and NASDAQ, or through the over-the-counter (OTC) market, representing shares of companies from at least 70 different countries.
ADRs are among the most direct and popular financial instruments for investing in foreign companies and have been actively used to diversify portfolios. In 2015, foreign equity holdings — through ADRs and local shares — accounted for 19% of U.S. investors’ equity portfolios.
Specifically, total global investments in DRs, both American and non-American, were estimated to be approximately $1 trillion USD, with about 90% specifically in ADRs, according to reports by JP Morgan. Some of the most traded Exchange-Traded Funds (ETFs) are comprised of ADRs as well. For instance, 14 Chinese ADRs were added to the MSCI Emerging Market Index in late 2015. The iShares MSCI Emerging Markets ETF (EEM), which tracks this index, has a market capitalization of $24 billion and daily average volume of 72 million shares.
Due to their cross-border nature, ADRs’ returns are significantly dependent on the market sentiments of both the U.S. and originating home markets. Especially, ADRs from Asia, such as Japan, Hong Kong, China, Taiwan, India, and Korea, are of particular interest for two reasons.
First, these ADRs provide U.S. investors with direct viable means to invest in foreign and emerging markets. Consequently, Asian DRs listed on non-Asian exchanges accounted for over 44% of the total DR market capitalization by the third quarter of 2015.
Second, the time zones for the aforementioned countries are 13 to 14 hours ahead of New York’s Eastern Standard Time (EST). Therefore, the trading hours of the U.S. market and their home markets do not overlap. The originating home markets open after the U.S. market closes and vice versa.
This leads to not only their asynchronous
returns with underlying equities but also the price fluctuations during and after the U.S. market hours. The connection (or contrast) between completely asynchronous markets has been of particular interest to especially multi-asset investors and other institutional investors.
Similarly, the time zone discrepancy allows us to split their returns into intraday and overnight components, each with fundamentally different price driving factors. For the Asian ADRs studied herein, intraday returns can be intuitively attributed to the news, conditions, and outlook of the U.S. market, whereas overnight returns are predominantly driven by the local Asian markets. We seek to understand the volatility contribution by different effects from each market.
Kang and Leung (2016) analyze the salient characteristics of ADRs, including the key statistics of the intraday returns and overnight returns, their distributions and correlations with the U.S. market. In particular, the correlation of each ADR with respect to the U.S. market is useful since it can serve as the basis of some trading strategies. Since intraday returns reflect price fluctuations during the U.S. market hours, they are expected to have a relatively high correlation with the U.S. market returns. On a similar note, overnight returns are expected to have a significantly lower correlation. The study determines these correlations, quantitatively contrast their effects on the overall volatility and performance of each ADR.
To exploit the mean-reverting ADR-SPY spreads, pairs trading strategies (long position in ADR and short position in SPY) are backtested.
The return difference between the S&P500 index, traded through the SPDR S&P500 ETF (SPY), and each ADR is found to be a mean-reverting time series, and is fitted to an Ornstein-Uhlenbeck process via maximum-likelihood estimation (MLE). Motivated by empirical observations the authors develop and backtest pairs trading strategies to exploit the mean-reverting ADR-SPY spreads and find consistent positive payouts when long position in ADR and short position in SPY are simultaneously executed at selected entry and exit levels. The paper is available in pdf here: https://ssrn.com/abstract=2858048
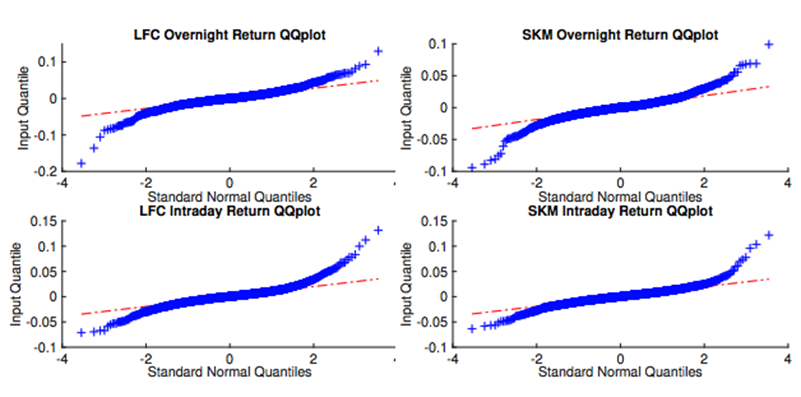
Quantile-Quantile plots of daily overnight and intraday returns for LFC (left) and SKM (right). For each graph, the x-axis represents theoretical quantiles of a standard Normal distribution and the y-axis represents quantiles of the true distribution of the data. The closer the crosses are to the straight reference line, the more normal is the empirical distribution.
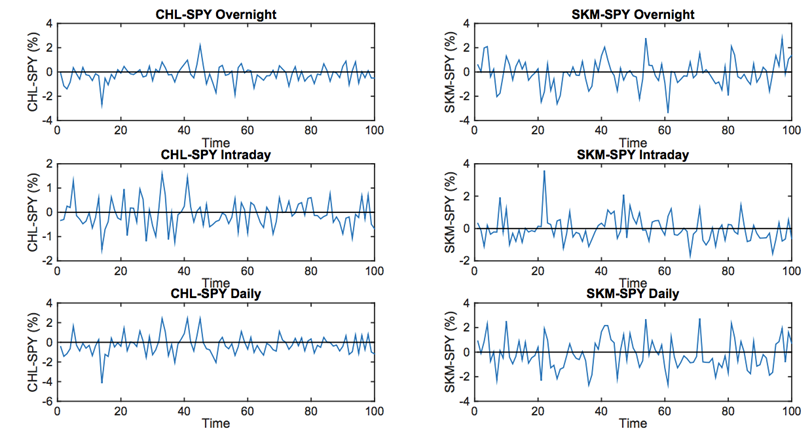
Time series of the overnight, intraday, and daily return spreads: CHL-SPY (left) and SKM-SPY (right).
References
Kang, J. and Leung, T. (2017), Asynchronous ADRs: overnight vs intraday returns and trading strategies, Studies in Economics and Finance, Vol. 34 №4, pp. 580–596. [link]
Disclaimer
This article represents the opinions and view of the author(s) and not, necessarily, of Qdeck. The content of this article is provided solely for informational purposes and general education, and in no way should be considered investment advice.
This communication is provided for informational purposes and should not be construed as a recommendation or solicitation or offer to buy or sell futures contracts, securities or related financial instruments, nor as an official confirmation of performance. Past performance is not necessarily indicative of future results. Investment in any program is speculative and involves significant risks, including risks of loss. There can be no assurance that the programs will be able to realize their objectives.
